Drinking Water
Recharging Groundwater with SWIFT
Virginia Beach, Virginia

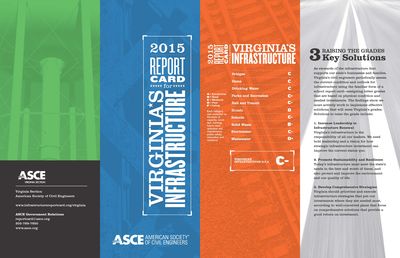
Virginia’s infrastructure is aging and affects Virginia’s quality of life, the safety of its citizens and its economic well-being. Using publicly available data, the Virginia Section of the American Society of Civil Engineers (ASCE) graded the condition of the state’s infrastructure assets, identifying the need for critical improvements and funding. Grades were assigned in 10 primary category based on the reported condition of existing assets, expected service life, current functionality and level of service, future growth needs, and anticipated level of funding required to maintain Virginia’s infrastructure.
Virginia has 20,997 bridges and culverts in our inventory, and the overall health of our bridges is in decline due to age and lack of funding. 56% of Virginia’s structures are approaching the end of their anticipated design life having been in service for more than 40 years. As part of this, 30% are over 50 years old. Virginia’s structures must be inspected regularly, with an average of 10,700 inspections annually so their condition can be evaluated. In 2013, Virginia’s inventory included 23.2% that were either structurally deficient or functionally obsolete. Of the major Virginia structures on the National Bridge Inventory, about 1 in every 4 bridges are structural deficient (meaning that they require maintenance, rehabilitation, or replacement) or functionally obsolete (meaning they no longer meet today’s design standards). These 4,871 structurally deficient or functionally obsolete structures are primarily a result of the gap between required and available funding. Available funds are often used to address immediate repair or replacement needs, leaving few remaining funds for preventative maintenance. Additionally, smaller structures have often been given funding which decreases the number of bridges requiring attention, but leaves a backlog of deferred maintenance on larger, more expensive structures. The statistics indicate an impending peak of replacements which may be required within the next 10 years and perhaps sooner, if needs are not addressed at a higher rate.
New state dam safety regulations enacted in 2008 will add approximately 1,400 dams to the existing inventory of 1,637 state-regulated dams. Dams not compliant with these regulations pose a potential hazard to 50,000 residents living in “dam break inundation zones.” The cost to bring regulated dams into compliance with minimum safety regulations are estimated to be as much as $220 million.
Virginia saw a large growth in public water systems after 1940, and Virginia now has 2,830 public water systems providing drinking water to more than 7M Virginians. Of this, 91% are served by waterworks that reported no water quality violations, however a large number of these systems have passed 70 years of age. Many require significant asset renewal in the immediate future. EPA’s latest assessment showed Virginia’s waterworks need nearly $6.1B to maintain our drinking water systems over the next 20 years. However, at only 72% of the national average, we must be diligent in identifying, defining and quantifying our needs to justify increased federal funding. From 2000 to 2012, Virginia was awarded $200M in Drinking Water State Revolving Funds. This investment addresses less than 10% of the total needs. In spite of increased needs, the award for 2012 was even less… at 5% of the total need. Deferral of the necessary improvements has worked so far, but can result in degraded water service, water quality violations, health issues, and higher costs in the future. A more robust plan to maintain our drinking water infrastructure is needed to avoid future problems.
Virginia’s public parks and recreation facilities are a diverse combination of national, state and local destinations which provide more than $18B in economic benefits annually from outdoor recreation in Virginia. When comparing the revenue generated by our state parks to the economic investment in the state’s general fund, it represents a return on investment of almost $11 for every $1 of general fund spending. However, Virginia has 5 new state parks which lack enough funding to develop and open to the public. Virginia also has more localities with vacant or missing positions for parks directors than was the case 5 years ago, for our last ASCE report card. For these reasons, the ASCE parks report card grade has been lowered. While park attendance in Virginia is on the rise, and our parks are consistently ranked as some of the best in the nation, leadership is needed to reverse recent trends. Open space and recreational opportunities are integral to our economy and our way of life in Virginia, and a lack of commitment to adequately fund and maintain our facilities will change things for future generations.
With 3,200 miles of railways across Virginia and some of the largest port facilities on the East Coast, we rank as one of the top states where freight carloads terminate, including 2 large Class I railroads and 9 Class III carriers. Amtrak and Virginia Railway Express (VRE) also have experienced explosive growth in passenger rail ridership using shared tracks for almost all of their routes. Recent reports cite limitations throughout Virginia’s railroad system that prevent the railroads from routing traffic over the primary corridors, with no high speed rail strategy for transit in the works. While some improvements have been made, Virginia will have to decide how to handle a doubling of rail traffic expected by 2035 including increasing passenger traffic. Realizing the importance of rail to Virginia’s movement of goods and economic vitality, Virginia developed its first dedicated source of funding, the Rail Enhancement Fund, for freight and passenger rail improvements in 2005. The Intercity Passenger Rail Operating and Capital Fund was also passed by the General Assembly in 2011, but no funding has been appropriated to the fund yet. While both funds can represent progress, the current funding is not sufficient to meet the increasing demand for rail and passenger service or to complete the much-needed rail infrastructure improvements and upgrades.
For decades Virginia’s roadways have provided safe, convenient travel for its citizens with the nation’s 3rd largest state roadway system. While the condition of the Commonwealth’s roadways are tolerable from a maintenance and safety standpoint, a lack of capacity results in traffic congestion and gridlock, especially in Washington DC-VA-MD and Hampton Roads regions that negatively impact commuters, industry, and the economy. The Washington DC-VA-MD metro area is ranked second worst nationally, behind Los Angeles. In total, Virginians have spent 28,000 years sitting in traffic based on a recent study, at a fuel cost of $5B, and the average DC-VA-MD commuter experiences 74 hours of travel delay per year – nearly two full work weeks of sitting in traffic. VDOT reports current needs for condition and/or capacity improvements on most of the interstate systems in Virginia including I-64, I-81, and I-95. Looking toward 2035, significant needs exist on all interstate and freight corridors. After 20 years of the status quo in terms of funding, the 2013 legislature made a significant step with House Bill 2313 to provide funding and begin addressing these challenges. However, with a network that has grown by 14% over the last 35 years and with every dollar buying less construction work, more funding is needed to maintain safe roadways while adding needed capacity, making this a high priority issue for Virginian’s.
Currently, more than 1,800 public school buildings serve Virginia’s K-12 students. To plan, construct, modernize and maintain school buildings that meet today’s educational needs is a challenging task for which local communities, the state and federal government have a role. In 2013, the Virginia Department of Education completed a comprehensive report on the age and needs of our school facilities and they found that more than 60% of our schools are at least 40 years old with estimated renovation costs exceeding $18B for schools over 30 years old. This is up from the $8.5B in estimated funding needs which were cited in 2008. It is not clear why the costs have more than doubled in 6 years, except to show how recent investments are not keeping up with needs. In fact, school construction spending decreased from $536M in 2008 to only $189M in 2009, while needs continued to increase. Encouragingly, the investment has slowly rebounded to 2008 levels so that deferred maintenance can begin to be addressed. Continued investment in our children’s education by providing safe and healthy learning environments is necessary to secure our future.
In 2013, the 208 permitted solid waste facilities in Virginia processed 20.2M tons of solid waste. Approximately 15M tons originated within the Commonwealth, while an additional 5.2M tons were brought in for disposal from out-of-state sources. For in-state waste, each Virginian averages 5.75 pounds of solid waste per day which is above the national average by about 30%; however, Virginians are doing about 7% more recycling than other states, and a growing number of recycling programs now collectively approach a 50% post-consumer solid waste recovery rate. Reductions in local and imported waste in recent years, along with 11 additional waste facilities are estimated to have increased the available capacity since our last report card from 20 to 22 years, however an additional 50% source reduction could eliminate over one million tons of additional solid waste annually, with an expected savings of some $40M per year to Virginia’s economy. More work is needed to maintain or improve our 22-year capacity to meet future needs; to reduce our reliance on imported waste as a revenue source; and to continue to increase recycling and reduce in-state sources of solid waste.

Stormwater infrastructure protects the health of our streams, rivers, wetlands, and lakes. In Virginia, large needs exist in many municipalities to comply with new stormwater regulations and to keep up with these needs, often with long construction time frames for capital projects making progress challenging. Recent surveys show about one-third of the infrastructure is older than 50 years and much of the remainder was built 25 to 50 years ago. While most stormwater infrastructure has a 50 to 100 year lifespan, keeping up with maintenance and using asset management planning are necessary to not undo the gains in water quality in Virginia’s rivers and the Chesapeake Bay. Increased attention and funding is working in concert with increased regulatory compliance requirements, but there are shortcomings to address for state level standardized reporting, public education, and ensuring a dedicated source of funding commensurate with the economic benefits of a healthy Chesapeake Bay and Virginia ecosystems.
Adequate wastewater treatment is vitally important to a healthy environment, human health and economic vitality. Virginia has $6.8B in wastewater needs over the next 20 years; a 45% increase from our previous report card in 2009. Factors causing this increase include aging infrastructure, more stringent federal regulations to restore water quality, growing demands, and increases in construction costs. Virginia has $1B in identified needs to control combined sewer overflows and prevent raw, untreated sewage from entering into Virginia’s waterways. Significant additional funding is needed to put the Chesapeake Bay and Virginia’s waterways on a “pollution diet” to restore water quality, including a 150-mile Chesapeake Bay “dead zone” between Baltimore and the York River in Virginia. A cleaner Chesapeake Bay is estimated to generate an additional $8.3B in economic benefits annually to Virginia. Virginia has made progress with considerable investments and has a comprehensive plan, but has tremendous challenges ahead.
A: EXCEPTIONAL, B: GOOD, C: MEDIOCRE, D: POOR, F: FAILING
Each category was evaluated on the basis of capacity, condition, funding, future need, operation and maintenance, public safety, resilience, and innovation

Aviation
48 public-use airports

Bridges
825 (5.92%) of the 13,932 bridges are structurally deficient

Dams
356 high hazard dams
Dams with EAPS
91% of the state regulated dams have an Emergency Action Plan

Drinking Water
$643 million in drinking water infrastructure needs over the next 20 years

Hazardous Waste
31 sites on the National Priorities List

Inland Waterways
670 miles of inland waterways, ranking it 17th

Levees
18 miles of levees

Ports
78.8 million short tons of cargo in 2012, ranking it 11st nationally

Public Parks
$870.13 million of unmet needs for its parks system

Rail
3,141 miles of freight railroads across the state, ranking 19th nationally

Road Costs
$430 per motorist per year in costs from driving on roads in need of repair
Roads
75,238 miles of Public Roads, with 10% in poor condition

Schools
$973 million gap in estimated school capital expenditures
Transit
69,889,907 annual unlinked passenger trips via transit systems including bus, transit, and commuter trains

Wastewater
$6.53 billion in wastewater infrastructure needs over the next 20 years
We can no longer afford to defer investment in our nation’s critical infrastructure systems.
Smart investment will only be possible with leadership, planning, and a clear vision for our nation’s infrastructure.
We have to utilize new approaches, materials, and technologies to ensure our infrastructure is more resilient.

New Report Affirms Higher Gas Tax is Needed to Restore Our Interstates
December 07, 2018
On Thursday, December 6, the National Academies of Sciences, Engineering, and Medicine, Committee for a Study of the Future Interstate Highway System, and the Transportation...
July 17, 2017
While all areas of infrastructure are important to address, with its “D-” grade—the lowest in the Report Card—transit would benefit from a little extra attention....
#GameChanger Trend – Next Generation Pavement
August 19, 2015
The United States has more than two million miles of paved roads. Maintenance is a continual issue for local and state transportation agencies, but new...

America Scores a D+
@YourCongressPerson
The 2017 Infrastructure Report Card gives our nation a D+ across 16 infrastructure categories #InfrastructureMatters

Fix the Trust Fund
@YourCongressPerson
#FixTheTrustFund to put us on a road to better transportation! #InfrastructureMatters