
Bridges, Roads, Transit
Town of Shakopee Develops Alternative Intersection to Reduce Congestion and Improve Mobility
Shakopee, MN

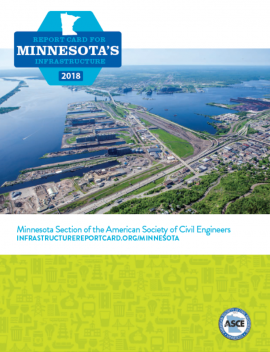
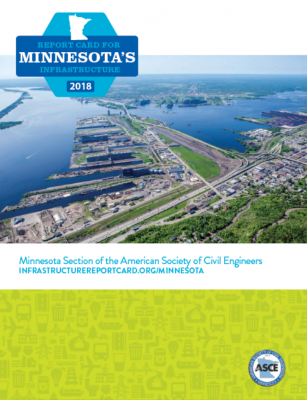 2018 Minnesota Infrastructure Report Card
Infrastructure includes fundamental facilities and systems necessary for Minnesota’s economy to function. Roads, bridges, transit systems, airports, water and sewer systems, dams, ports, and energy systems are categories of infrastructure that directly affect our ability to live, work, and play. Infrastructure is the backbone of our state’s economy and integral to preserving our high quality of life here in the Gopher State.
Our transportation system gets people to work every day or to the lake on the weekends. Water systems deliver clean drinking water to our homes, communities, and businesses. Wastewater treatment systems protect our lakes, rivers, and drinking water sources from contamination.
Much of Minnesota’s infrastructure is aging and reaching the end of its expected lifespan. The majority of our systems were built in the late 20th century, before much of today’s modern technology was developed. New materials, expanded environmental awareness, and increased regulation require improvements to wastewater and drinking water treatment plants.
The energy grid, transportation systems, sewers, and drinking water systems of decades ago need upgrading to better prepare for larger storm events, increased use of renewable fuels, and a changing population.
Broader adoption of asset management systems can help inform systematic operations, maintenance, and upgrades. Comprehensively tracking the age, repairs, and maintenance status of the infrastructure we have will help control and reduce disruptive emergency work. Minnesota must support innovative policies leading to cleaner water, more drivable roads, and a safe environment that will attract business and improve our quality of life.
The 2018 ASCE Minnesota Report Card is a simple tool used to help residents, businesses, and policymakers understand the state of Minnesota’s infrastructure. This information helps start the conversation about how to improve the future of our infrastructure.
Click here to read the Minnesota Infrastructure Report Card Executive Summary.
The Minnesota aviation system services 2.3 million aircraft operations (takeoffs and landings) annually, and includes 135 airports, 97 of which are a part of the National Plan of Integrated Airport Systems. Nine airports provide commercial airline service, including Minneapolis-St. Paul (MSP), which accommodated a record 18.4 million enplanements in 2017. MSP and the reliever airports have undergone considerable upgrades over the past five years, including $455 million in improvements in 2017 alone. From 2018–2022, MSP and its reliever airports forecast needs of $170 million per year while airports in Greater Minnesota (outside the Twin Cities Metropolitan Area) forecast needs of approximately $96 million per year. The condition of Minnesota’s airports is reasonably good, and minimal capacity issues are foreseen in the near future. Safety records are solid, and sustainability is proactively integrated within infrastructure and operational decisions.
One result of the I-35W bridge collapse was a decade-long effort to address long-deferred bridgework. But there is more work to be done. Much is known of the condition of the 19,776 bridges in Minnesota. Thousands of Minnesota bridges are nearing the end of their design service life. Statewide, 5.4% of bridges are structurally deficient, and state and local agencies struggle to obtain funding for necessary projects. Due to congestion, there are several large interchanges in the Twin Cities with sizable bridge structures that will soon need to be upgraded. Additionally, there are over 500 bridges posted with signs stating they have a reduced or substandard load capacity, and over 400 bridges that do not meet geometric standards. Bridges in the state need $5.4 billion in funding over the next 20 years. Only $3.22 billion in funding has been identified, leaving a shortfall of $2.18 billion, or $108.8 million each year.
The majority of Minnesota’s dams are at least 50 years old and 50 years is the typical dam design life, according to the Minnesota Department of Natural Resources (DNR). Dams provide flood control, fish and wildlife protection, recreational areas, and hydroelectric power, among other social and economic benefits. A dam is classified based on the probable losses to the public if the dam were to fail. Minnesota has 199 high- or significant-hazard dams and 83 of these have an emergency action plan. Both the state and federal government have programs to help fund repairs or removals of dams when the dam becomes a threat to the public. The lack of funds to perform needed maintenance and the fact that many dams were not designed to handle the larger rain events we are now experiencing are major challenges for Minnesota. An estimated $114 million is needed over the next 20 years to assure public state-regulated dams remain in a safe and stable condition.
Approximately 79% of Minnesotans are served by community water systems while 21% of the population relies on private wells for drinking water. In total, about 75% of drinking water is sourced from groundwater and the remaining portion from surface water. The U.S. Environmental Protection Agency estimates the 20-year drinking water infrastructure need for Minnesota is over $7.5 billion—and unless funding is increased, most of this will be raised through local utility fees, which are climbing to meet costs of pumping, treating, storing, and distributing water. Aging infrastructure and increasingly high demands for funding lower the grade. Although large communities’ drinking water systems have consistently met federal standards, far less is known about the private wells many people in rural Minnesota rely on.
The state’s energy portfolio has changed significantly over the past decade to successfully meet greenhouse gas emissions reduction goals by bringing on more renewable energy, wind, and solar, and reducing the use of coal. The energy industry is working hard to meet these goals. But challenges remain. The industry must prepare for growing consumption, especially during the summer months. The region’s summer demand is projected to grow 0.85% per year for the next seven years. Ensuring reliable and dependent access to energy is critical; without it, Minnesota’s economy grinds to a halt.
Of Minnesota’s port capacity, 80% is contained in ports along Lake Superior (Saint Lawrence Seaway), with the remaining 20% of capacity contained in ports along the Mississippi River. Ports are major economic drivers linking cities to world markets. While capacity in Minnesota’s ports is sufficient, the ability of each facility to secure funding to improve the condition of its infrastructure varies. The condition of the ports require attention in the future as the structures typically have a 50-year design and a fair portion are at or near the end of their design service life. Other challenges that facilities are grappling with include corrosion of steel structures, dredging backlogs, dock wall construction, creation of new storage facilities, building/road rehabilitation, improving land access to the ports, gentrification, and upgrades to meet safety codes.
Minnesota has the fifth-highest number of public roadway miles in the U.S. Even as our economy remains strong, Minnesota is facing a growing transportation funding shortfall with no clear remedy. The Minnesota State Highway Investment Plan (MnSHIP), published in 2017, estimates that state roads are underfunded by $17.7 billion over the next 20 years, an annual funding gap of $885 million. Without significant public investment, our roads and bridges will continue to fall into disrepair. The primary sources of state funding are fuel, registration, and vehicle sales taxes. Relatively small adjustments to any or each of these could help bridge known funding gaps. Condition of roads is not the only concern, either. Congestion is a major problem in the Twin Cities: the average driver spends 41 peak hours in congestion each year, averaging a cost of $1,332 per driver. And the problem is only going to get worse. The metro area gained 43,000 new people in 2017 and 250,000 since 2010, according to the U.S. Census Bureau.
Public transportation provides 111 million rides each year in Minnesota. Although the Twin Cities has the lion’s share of transit infrastructure, Greater Minnesota has more than 50 public transit systems and has seen a dramatic increase in ridership over the last decade. A $450 million investment over the next five years is needed to keep our existing transit infrastructure in working order. That figure grows to $5 billion for the next 20 years. Despite this need, current funding levels are not enough to take care of what we have and meet the demand of continually increasing ridership. Efficiency and quality of service can be improved, but innovative thinking cannot replace an appropriate level of infrastructure funding. Funding for public transit is complex, but state and local leaders can adopt measures that would ensure a long-term, dedicated, and sustainable revenue stream for public transit similar to how the gas tax funds roads and bridges. A strong investment in public transit infrastructure ensures that the buses, vans, and trains will continue to take Minnesota’s growing population to the places they need to be.
About 84% of Minnesota residents receive wastewater treatment from a centralized collection and treatment system, while the remaining 16% rely on an on-site collection and treatment system such as a septic system. Although capacity is adequate at most facilities throughout the state, funding for upgrading and replacing treatment and collection systems at the end of their planned service life is lacking. There is an estimated annual need of $236 million, of which local communities will provide about one-third, for current wastewater needs. Ratepayers were charged an average annual rate of $268 in 2016 in the metro area for operation and maintenance and capital investments. In Greater Minnesota, user fees are much higher and will continue to rise as decreasing populations shoulder more of the burden of increasing rates.
A: EXCEPTIONAL, B: GOOD, C: MEDIOCRE, D: POOR, F: FAILING
Each category was evaluated on the basis of capacity, condition, funding, future need, operation and maintenance, public safety, resilience, and innovation

Aviation
97 public-use airports

Bridges
709 (5.31%) of the 13,329 bridges are structurally deficient

Dams
53 high hazard dams
Dams with EAPS
96% of the state regulated dams have an Emergency Action Plan

Drinking Water
$7.51 billion in drinking water infrastructure needs over the next 20 years

Hazardous Waste
25 sites on the National Priorities List

Inland Waterways
260 miles of inland waterways, ranking it 27th

Levees
182 miles of levees

Ports
43.5 million short tons of cargo in 2012, ranking it 17th nationally

Public Parks
$128.5 million of unmet needs for its parks system

Rail
4,258 miles of freight railroads across the state, ranking 8th nationally

Road Costs
$542 per motorist per year in costs from driving on roads in need of repair
Roads
139,449 miles of Public Roads, with 14% in poor condition

Schools
$818 million gap in estimated school capital expenditures
Transit
107,309,651 annual unlinked passenger trips via transit systems including bus, transit, and commuter trains

Wastewater
$2.39 billion in wastewater infrastructure needs over the next 20 years
We can no longer afford to defer investment in our nation’s critical infrastructure systems.
Smart investment will only be possible with leadership, planning, and a clear vision for our nation’s infrastructure.
We have to utilize new approaches, materials, and technologies to ensure our infrastructure is more resilient.

New Report Affirms Higher Gas Tax is Needed to Restore Our Interstates
December 07, 2018
On Thursday, December 6, the National Academies of Sciences, Engineering, and Medicine, Committee for a Study of the Future Interstate Highway System, and the Transportation...
ASCE Gives Thanks for Infrastructure Successes
November 21, 2018
It’s that time of the year again – turkey, time off work to be with family and friends, and traveling headaches due to crowded airports...
Minnesota Earns a “C” in First Infrastructure Report Card
October 10, 2018
On Tuesday, October 9, civil engineers gathered at the Minnesota State Capitol for the release of the first-ever Report Card for Minnesota’s Infrastructure. The...

America Scores a D+
@YourCongressPerson
The 2017 Infrastructure Report Card gives our nation a D+ across 16 infrastructure categories #InfrastructureMatters

Fix the Trust Fund
@YourCongressPerson
#FixTheTrustFund to put us on a road to better transportation! #InfrastructureMatters
